For a good while now I have been relatively cynical of the “100% Compliant” statistic that I see on certain servers in the Patch Manager and I have been considering how best to approach finding problems with patching that were not otherwise being highlighted. I designed this report to follow an important Automate mantra; trust, but verify. This report is my way of approaching the verify from a different angle. My thinking here is as follows:
1) Now that patch installs are cumulative, monthly or service stack updates, I can use that to my advantage
2) Represent the data grouped by OS with the last patch installed of the “Cumulative” type visible
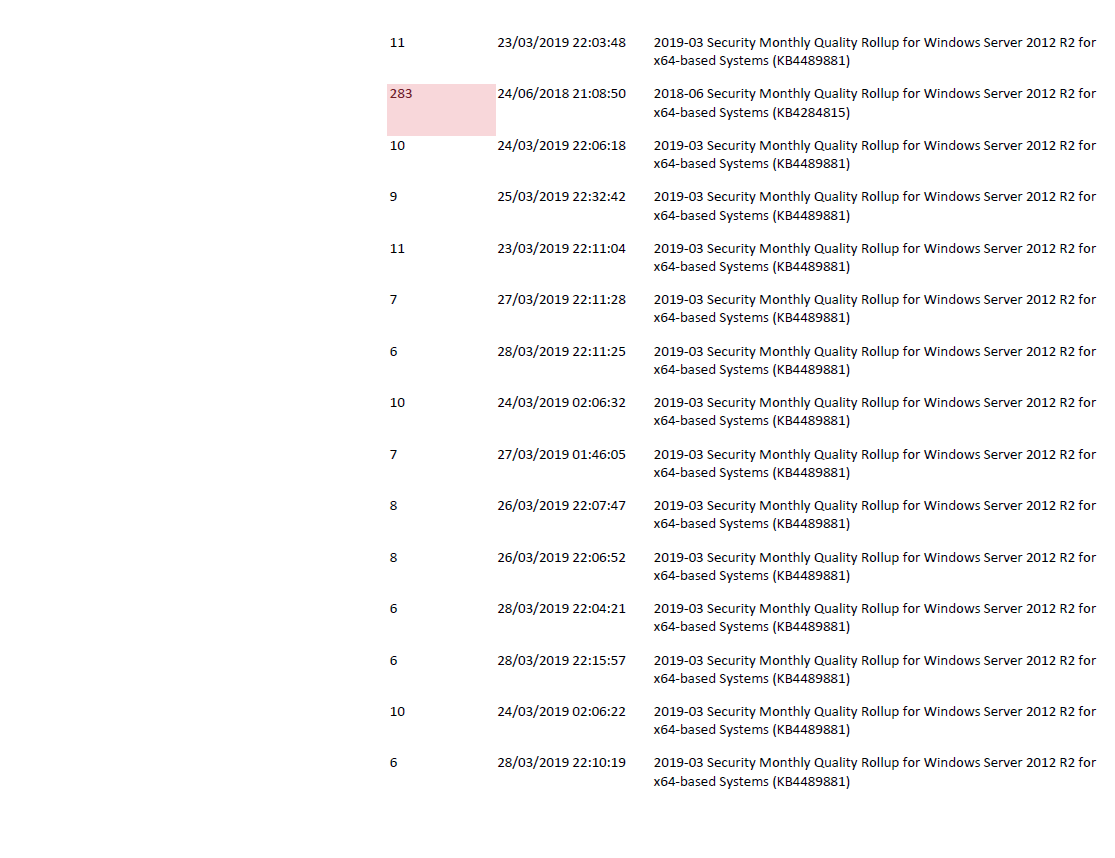
3) It makes spotting machines of a similar type that are not truly patching a lot easier. If 50 Server 2012 R2s have the last installed patch as 2019-03 Security Monthly Quality Rollup, and 1 Server 2012 R2 has the last installed patch as 2018-07 Security Monthly Quality Rollup then something is wrong!
To illustrate this, here are some screenshots from my own running of this report:
These servers are all healthy:
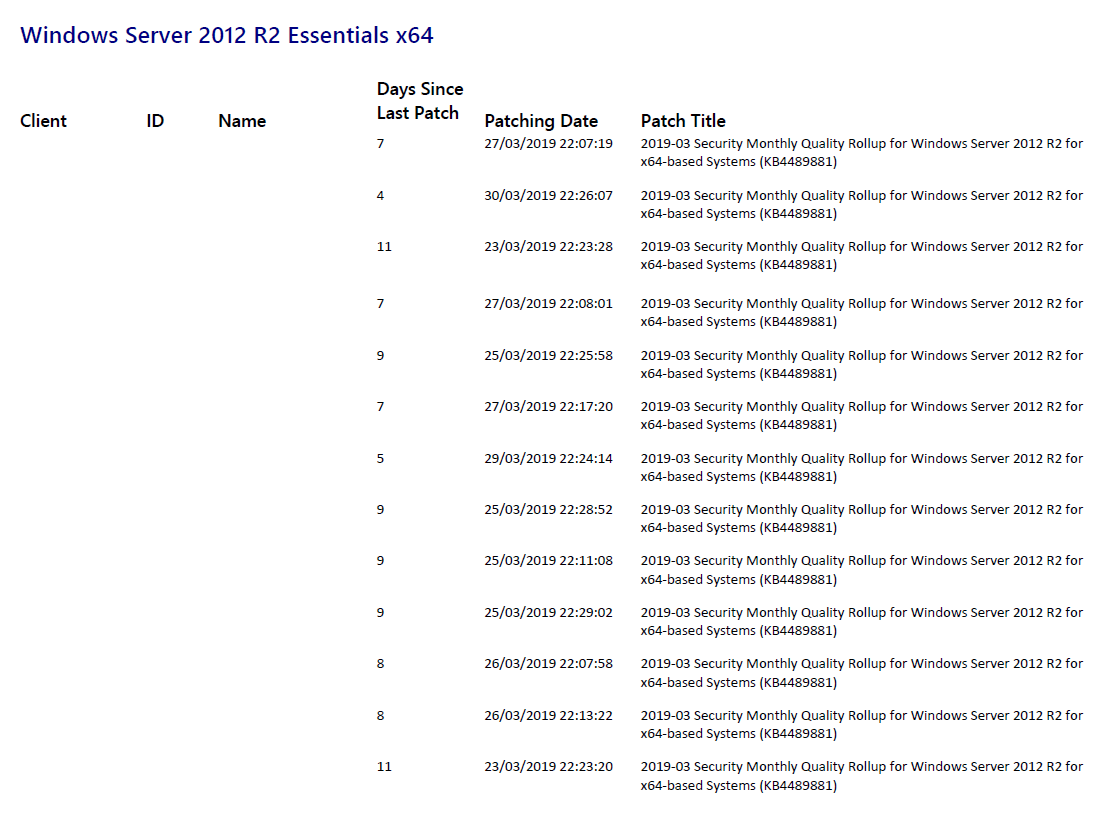
One of these servers are not…. you can see how the last cumulative was in 2018-06 based on the name of the Patch:
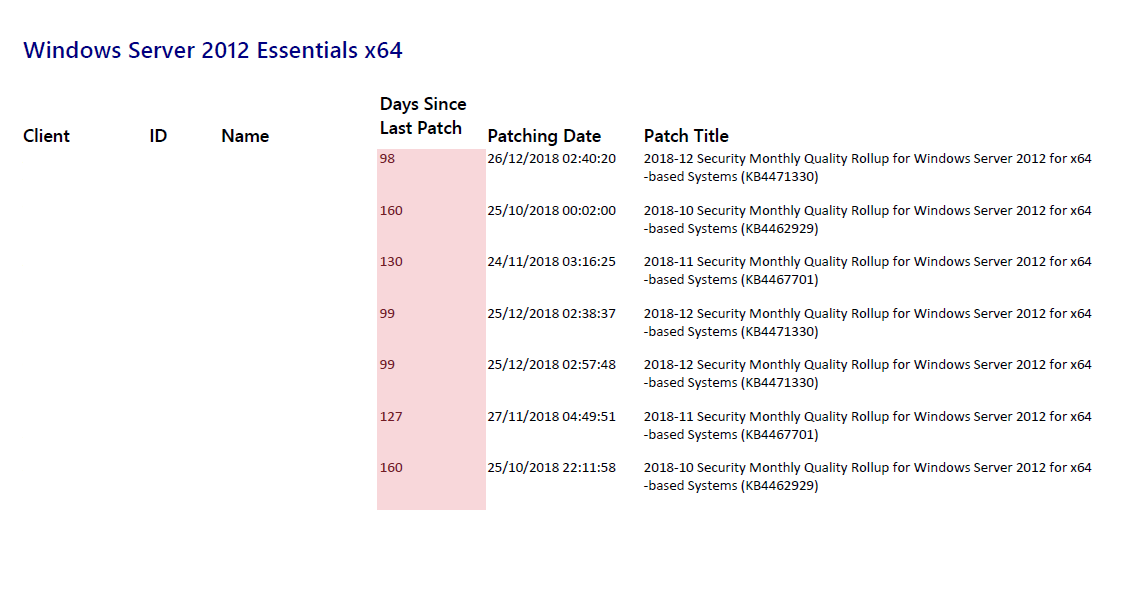
Nearly every single one of my Server 2012 Essentials is broken (I hate this particular OS)
A number of people have tested this report in the MSPGeek Slack, and so far everyone has found something that was broken.
Whatever you find on this report, I am interested to hear feedback. Please e-mail me through the contact form or come speak to me on the MSPGeek Slack (I am @Gavsto). To import this report, open the Report Center, go to Report Designer, choose open, browse to the REPX file, publish to database then run from the report list. Do not select a computer or the report won’t work, when running don’t select anything in quick filters.
This report does not support Server 2003, and neither should you!
If you’re interested in the raw query underpinning this report:
SELECT
   vxr.computeros,
   vxr.computername,
   vxr.clientname,
   vxp.computerid,
   DATEDIFF(NOW(), vxp.actiondate) AS DaysSinceLastPatch,
   vxp.actiondate AS patchingdate,
   vxpt.title AS patchingtitle
FROM
   v_xr_computers vxr
   JOIN
      (
         SELECT
            MAX(`ph`.ActionDate) AS patchingdate,
            computerid
         FROM
            patchhistory AS `ph`
            JOIN
               `patchhistorytitles` AS `pht`
               ON `pht`.`ID` = `ph`.`PatchHistoryTitleID`
         WHERE
            (
               `pht`.title LIKE '%Security Monthly Quality%'
               OR `pht`.title LIKE '%Servicing Stack Update%'
               OR `pht`.title LIKE '%Cumulative Security Update%'
               OR `pht`.title LIKE '%Cumulative Update For%'
            )
            AND `pht`.title NOT LIKE '%Cumulative Security Update For Internet Explorer%'
            AND `pht`.title NOT LIKE '%Cumulative Security Update for ActiveX%'
         GROUP BY
            `ph`.computerid
      )
      AS t2
      ON t2.computerid = vxr.computerid
   JOIN
      patchhistory AS vxp
      ON vxp.computerid = vxr.computerid
      AND vxp.actiondate = t2.patchingdate
   JOIN
      patchhistorytitles AS vxpt
      ON `vxpt`.`ID` = `vxp`.`PatchHistoryTitleID`
WHERE
   vxr.computerisserver = 1
ORDER BY
   vxr.computeros ASC
I look forward to any feedback or suggestions for improvement. This report is experimental in that the more feedback I get the better I can make it. I’ve not run this against workstations yet, I’m scared to see what I will find to be honest.
Download the report below.


none of this views are present in my database.. did you sutom create these views?
This is really great! Is there a way to edit this so it also shows desktops and not just servers? Or maybe it already does and I am missing something?
Hi David,
Did you figure out how to report on workstation patch levels too?
Hi, have you noticed missing patch data from the patchhistory table? We have some machines that are recording cumalative updates in the “hotfixdata” table seemingly randomly, wondering if you noticed the same thing?
This is all well and good, but this just displays the ATTEMPTS. You aren’t checking patchhistory.resultcode to see if it’s successfully patching. It looks like 2 is good, and 4 is bad but I also have 1, 3, and 5.
from
https://automationtheory.org/schema_2020-10/tables/v_xr_computerpatchhistory.html