I spent a very difficult few days figuring out the Labtech report center about a week ago, with not much documentation or usage cases around with it being relatively new I decided to dive in to see what I could do.
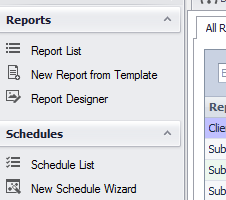
I’m going to go through how to do this from scratch so as to hopefully help people trying to design reports. As per a reddit post that sparked this post, I am going to do a report that will report back on all network drives that are mapped to a computer. Firstly, open the new Report Center.
Generating a report from scratch, using a base template
1. New Report From Template:

2. Choose Computer base, and click OK
3. Choose Add new report, choose a report name and a category that makes sense for the report you are creating. Click publish.
4. Your report will open in the report designer. If you were to run this report as is, it would display some details about every computer in your Labtech database. You can preview the report as it currently stands by clicking print preview
Field lists and their importance to reports
The field list (right hand side) allows for the dragging and dropping of data items directly on to the report. To see these, click field list and expand “Computers”.
What you are seeing here is a list of fields that relate to the Computer in Labtech. You can drag these onto the form directly. There are different types of ‘fields’.
The main ones, ‘ab’ is a property containing text. ‘123’ is a property containing a number only. The clock one is a date. The ‘f’ is known as a calculated field. These are used to amalgamate numerous fields and format them in such a way that allows for easy viewing in a report. For example, it allows you to add Mb to the end of a megabyte value without changing the value in the database. It would allow you to add two numeric fields together in your report by creating a calculated field and doing a sum.
Property Grid
This holds all information about properties that are set on generally the thing you are clicked on – this will come into play soon. Just be aware of its existence for now.
The report and the report designer
To understand what you are seeing in the report designer, I will go through each step.
Report Header:
This “band” is actually a sub report which represents the first page of your report. Don’t be fooled by it’s small screen estate. This is the page that generates your logo and company name, report name and any additional details you have in it. You can’t edit it from this view, you can double click it and open the sub report and edit it from there. If you do open it, note that it opens in an additional tab. You can go back to the other report by navigating through the tabs
A few hints and tips for the ReportHeader!
You cannot change the report name from here it actually picks up the report name from the field list on the main form. In the field list, look under Data > Computer and Report Name:
- If you modify the sub-report it will modify every front page for every report – bear this in mind
- You can edit this report name in the Expression below:
Individual parts of the report
With the report header selected:
You can see how it decides to give the front page an entire page all to itself. This is done with a property called Page Break – if set, this will cause anything after this section (or before this section depending on how you set it) to be pushed onto a new page.
The next section, page header, refers to the actual header on each individual page. This is also a sub-report – and I would caution against changing it for the same reasons listed above.
The meat of the report ‘detail’ and ‘detailBandComputer’
As far as I understand it, this part of the report will repeat for each unique row that exists in the data source. I’ll delve a bit deeper into data sources later, but essentially for each computer row that exists in the Labtech database, this section will populate. If you do a print preview on the report at this time, it will print the information listed above out for all computers in the report.
If I wanted to include say the ComputerMAC, you would drag it from the right hand side on to your report surface.
A handy tip! As you will see above, the font is different after I dragged the field onto the report surface. You can set the default font for anything pulled onto the report by clicking the arrow at the top left of the report:
Doing that will select the entire report, you can then change the font in the property grid. This will set the default font for anything on the report, and anything dragged in from the field list. I prefer Segoe UI and not the default Times New Roman because I am not a monster.
Another handy tip! Using the toolbox on the left hand side of the report designer, you can drag on a label to the report. If you double click it, it will allow you to edit the text label. You can then, believe it or not, label things. If you want to copy the font formatting from one of the previous labels to make it match existing things in a report, click on one of the ones where you want to copy the font formatting, find the font property in the property grid, select all the text in that property, click your new label, delete the contents of its font property and paste. Then press enter to apply.
There are plenty of properties for modifying the visual appearance of anything dragged onto the form, they are relatively self explanatory so I won’t go into them in any detail.
Your detailBandComputer should now look like this:
Stepping it up a notch
Now we’re happy getting basic information out of the computer field list, we are going to modify the report to include basic information about network drives that are mapped on that particular machine. It’s important to understand the the data for this, held in the Labtech database is not stored within the Computer table – we will have to add it in.
Click on Edit Data Source
You can see on the left hand side the existing query for this report, which is bringing back computer information. (Technical side note, this is not querying the computers table directly but instead it is querying an SQL view).
Under Queries side, click Add. You are presented with a number of fields to fill in.
Query Name: This is a friendly name for you so you can identify this data source, a good choice in this instance is MappedNetworkDrives
Source: Use the dropdown and choose the table or view where the data you need is stored. In our instance, the table is called networkdrives
Where SQL: Can be used to limit the data that is returned by this query, in its current state it will return everything. You could use this field to say “Only bring back mapped drivers that have a letter of L:” as an example
Once you have selected the source, it will pre-populate a list of available columns.
You can include them by clicking the arrows. You can either choose to include everything (click the double arrow) or if you only need individual bits of information, you can select it on the left hand side and use the single arrow to include it in the included columns. In this instance I will include everything. It is imperative that you include the column that you are going to use to link this data back to the computer in the report. As you can see, the networkdrives table has a column called ComputerID, this unsurprisingly reflects the Computer that these network drives are on.
After ensuring you’ve clicked the double arrow and included columns is identical to the available columns, Click OK.
We now need to build a relationship between the two sets of data we have. Click Add under relationships.
Relationship Name: A friendly name, I will use ComputerToMappedDrive
In the Parent section, choose Data source > computers and Member ComputerID (it should populate the member automatically). In the Child section, choose Data Source MappedNetworkDrives and ensure Member is set to ComputerID NOT DriveID.
https://i.imgur.com/Ih5TNaQ.png
What we have done here is defined a relationship between the “MappedNetworkDrives” data and “Computer” data. Computers is the parent because all though you can have a computer without a networkdrive, you can’t have a network drive without a computer.
Click OK and OK again.
You will see the field list has changed on the right hand side.
https://i.imgur.com/fnRQoMj.png
You can see the fields from both of these tables by expanding them in the field list
Super Important Tip – If you are anything like me, you’d expand the MappedNetworkDrives, and drag the fields underneath onto the report and expect that to work. Wrong! I spent 3 hours messing about with this until I discovered the fields I need to drag on are actually underneath the Computers and then underneath the relationship name we defined before:
https://i.imgur.com/MqjbDyf.png
These are the fields you actually need to drag on to the report. So lets drag on Letter and Model. Before doing that, I want to make the report area bigger in the detailBandComputer – you can do that by clicking and dragging at the bottom of the report and resizing it like a window. Drag the fields on:
https://i.imgur.com/bUkClbo.png
Go to print preview and have a look at your report, it should look like this:
http://i.imgur.com/rbIZKhi.png
It worked! Congratulations! You are now a “certified” Labtech report designing hero!
But wait…. what if they have more than one mapped network drive. Lets delve a little deeper.
Into the rabbit hole…
It took me a long time to work this out when I first started looking at this initially. To start, remove the two fields we put on in the previous step and resize the detailBandComputer back to to its default size. Right click in the detail part of the report, and go to Insert Detail Report > ComputerToMappedDrive
http://i.imgur.com/FKxpyHk.png
This includes another band called DetailReport – “Computers.ComputerToMappedDrive”. In essence, this “band” will iterate over every entry in mapped network drives as defined by our relationship previously.
https://i.imgur.com/HACKBYU.png
Select the detail report, and Right click, insert band group header. It now looks like this:
https://i.imgur.com/NsrCy6P.png
Anything in the group header section will not repeat, allowing you do things like design tables with column headings. In the following I have resized the group header, dragged on two labels, spruced the font up by making it a bit bigger on the labels, changed the text alignment and labelled the labels Drive Letter and Model.
https://i.imgur.com/t3WkpTl.png
I can now drag my fields on. I dragged on Data>Computers>ComputertoMappedDrive Letter and Model into the detail part of this details report. I have also resized the detail part to minimise the space between each row. Run a print preview on your report.
http://i.imgur.com/SNnD1po.png
It worked!!!!
Best get that report saved and published.
In the report designer, click Save. You will be prompted to save as a normal file. I save these in my LabtechShare in the reports folder. This does not publish the report to the report manager.
Once you have saved, click the Publish to the database button. You can either choose to add a new report, or replace an existing one. Click Publish.
https://i.imgur.com/7dyPksd.png
That’s it – if you refresh the report center (top right) you will be able to see your report.


Amazing, thank you!
And where do I pick the dates for the report?
For example, lets say I want to make a report from specific dates, or just for the last 15 days, etc.
Manny – I’m looking for an answer to this also. Did you ever find how to scope your report to a specific date range?
Hi Steve,
I know this is an old thread, but have you found how to specify a date range?
Excellent write-up, thank you!
Thank you!
Great Tutorial! Thank You. LabTech support needs to add this to their documentation!
Hey dude thx for the tips. Your picture links are broken pleeze fix
This is great! Thanks a lot!
One issue I can’t seem to get around is the file share path keeps getting truncated after 35 characters. Any ideas?